Download full April End-of-Month Credit Update infographic below.
Credit Benchmark has released the latest end-of-month consensus credit data (from March 2020), based on the final and complete set of contributed credit risk estimates from 40+ global financial institutions. This final update takes into account the credit movements of ~26,000 separate legal entities.
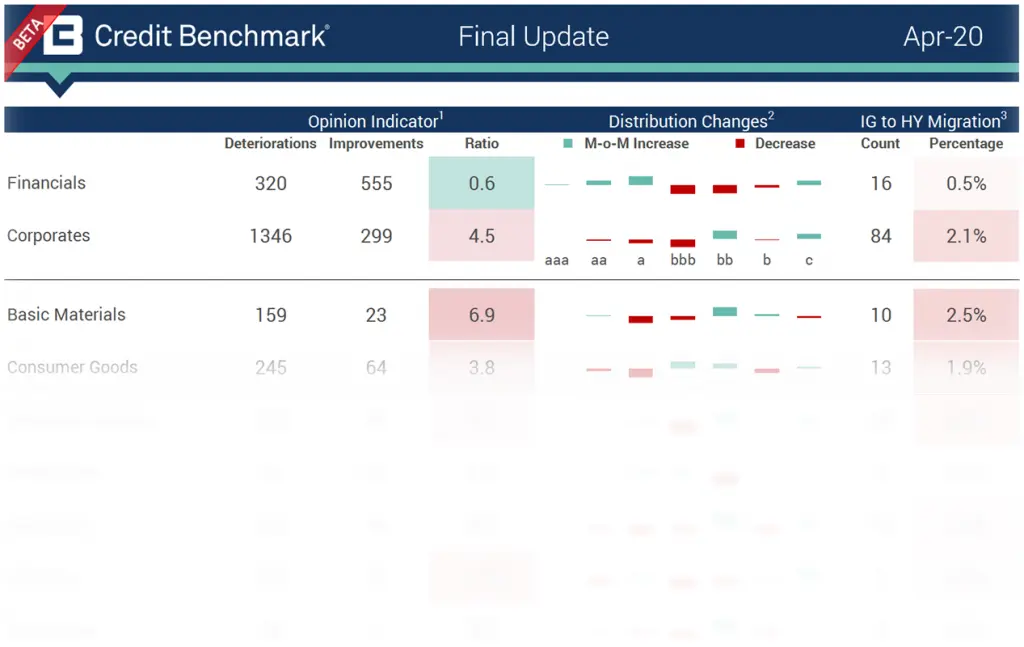
In the update, you will find:
- Opinion Indicator: Assesses the month over month observation-level net downgrades or upgrades.
- Ratio: Ratio of Deteriorations and Improvements calculated as Deteriorations / Improvements
- Distribution Changes: The increase or decrease in the percentage of entities in the given rating category
- IG to HY Migration: The absolute and relative movement from investment-grade to high-yield
Compared to the figures seen in our mid-month flash update, the final update shows:
- The bias towards deterioration flagged by the opinion indicator ratio is less pronounced but still strong.
- The opinion indicator marks most impacted industries:
- There is an 11:1 deteriorating/improving ratio for Oil & Gas entities (down from 14.7:1 in the flash update).
- There is an almost 7:1 deteriorating/improving ratio for Basic Materials (down from 8.8:1).
- There is a 6:1 deteriorating/improving ratio for Consumer Services (down from 7.3:1).
- And Consumer Goods show the biggest ratio drop, with the ratio now just below 4:1 deteriorating/improving (down from 9:1).
- The percentage of Investment Grade (IG) entities migrating to High-Yield (HY) increased for almost all the cuts. Consumer Services show the strongest tendency to transition to HY with 5.3% of IG entities migrating (up from 3.4%). Travel & Leisure is one of the most impacted sectors with more than 15% of IG entities being downgraded to HY (up from 9%).
Credit Benchmark will continue to provide regular reports on these migration rates. If you have any questions about the contents of this update, please get in touch.