
A decade of Credit Benchmark data reveals major global credit shifts.
Credit Benchmark’s Credit Consensus Rating universe now covers more than 118,000 borrowers with a 10-year monthly history. Consensus ratings are based on 1-year ex ante Real World Probabilities of Default (PDs) used for regulatory and economic capital calculations.
Transition Matrices (TMs) summarise credit migration behaviour of this borrower universe, segmented by geography and industry. These can be used to project default risk term structures for multi-year time horizons.
PD term structures derived from TMs have a wide variety of uses: Credit Value Adjustment (CVA) calculations, fair value accounting, bond pricing, portfolio risk projections, and index default rate forecasts.
The following example shows how TMs can be used to create term structures and compares the results with the more basic “survival rate” calculation. The example is based on the following consensus data:
The Credit Benchmark Long Term (2018-2025) Global Corporate TM:

Credit Benchmark PD Assumptions vs. S&P
The table below shows S&P long run global median default rates vs. Credit Benchmark 1-year default rate assumptions used to map average PDs to 7-category credit grades.
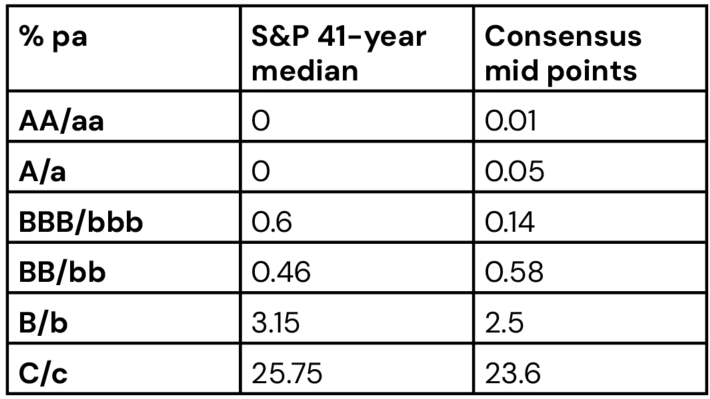
Source: 2024 Annual Global Corporate Default And Rating Transition Study March 27, 2025; Credit Benchmark
The bb, b and c rates (the main sources of defaults) for borrowers of bank loans are similar to long run S&P BB/B/C rates for corporate bond defaults for those categories.
Reported S&P default rates show considerable variation over their 41-year history, depending on phases of the credit cycle. The standard deviation for the c category, for example is 11.6 (Maximum rate reached close to 50% in the 40+ year history).
Default rates shown here are used as long run averages, but observed default rates vary not just over the credit cycle but also across regions and sectors. Practitioners typically adjust annual default rate estimates to allow for these differences; granular transition matrices can provide robust validation for these detailed assumptions.
Recent research by Credit Benchmark shows that Credit Consensus Ratings perform as well as S&P in predicting actual default rates for the period (see Discriminatory Power of Consensus Ratings.)
The two columns in the Credit Benchmark vs S&P table can be combined in one matrix (M):
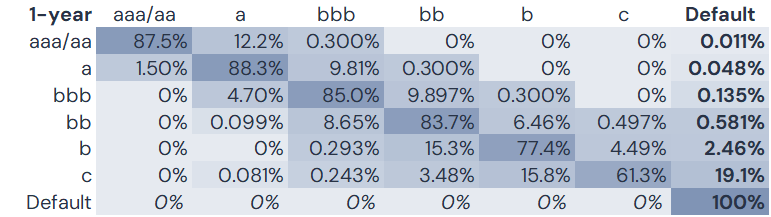
Note that the c category rate of 19.1% is significantly lower than the earlier 23.6% estimate which ignores upgrades – effectively a % of the original c category members that still remain.
Jump-to-default rates in final column (bold). Default recovery in bottom row (italic). 3 decimal places for values less than 1%.
Each row combines the transition matrix row with the default rate for that row; these are normalised so that the row sums to 100%. This version assumes no recovery from default within 1 year.
We could ignore these transitions and just assume that the 1-year survival rate for the c category is (100% – 19.1%) = 80.9%, so the 2 year survival is 80.9%2 = 65.44% giving a 2-year default rate of 100%-65.44% = 34.55%.
More realistically, the 1-year matrix can be multiplied by itself (a.k.a. “powered up”) to calculate multi-year cumulative default rates. The example below shows the 2-year version:
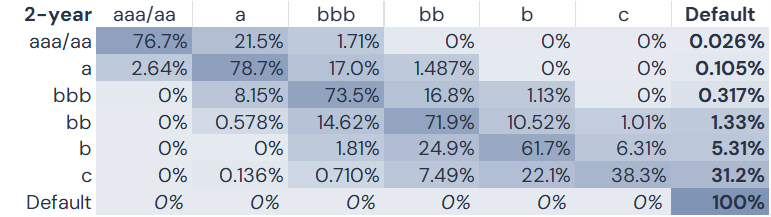
This assumes the TM is “Markovian” i.e. obligor identity does not matter, so all obligors in the same credit category are subject to same migration rates. Alternatively, country and sector matrices can be used to model other drivers of migration rates.
The projected probability that an obligor in the bbb category remains in that same category after 2 years is 73.5%. (NB Some obligors will have migrated out of and back into the bbb category over this period.)
Using the matrix approach, the 2-year default rate for the c category is 31.2% – about 10% lower than the survival approach. Conversely, the aaa/aa cumulative default rate of 2.6 Bps is more than double the 1-year rate of 1.1 Bps. These differences arise because – over the 2 year period – various obligors are assumed to upgrade or downgrade according to the historic rates in the matrix. The exceptionally high upgrade rate from the c category is the reason that the 2 year TM-based default rate is about 10% lower than the survival rate estimate.
Powering up over 5 years (making the bold assumption that the next 5 years will be like the past 8 years) gives the following cumulative default rates:
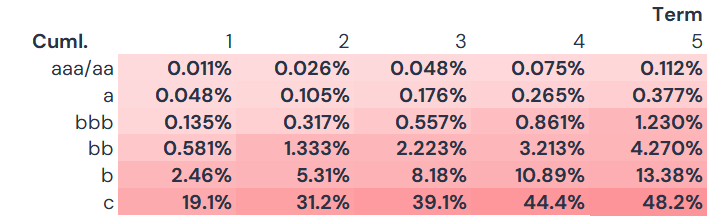
After 5 years, the probability that a c category obligor (bottom row) has defaulted is 48.2%. For the aaa/aa category it is 0.112%, and 1.23% for the bbb category.
This can be converted to a PD term structure by for example, converting these cumulative PDs to 1-year survival rate based equivalent 1-year PDs:
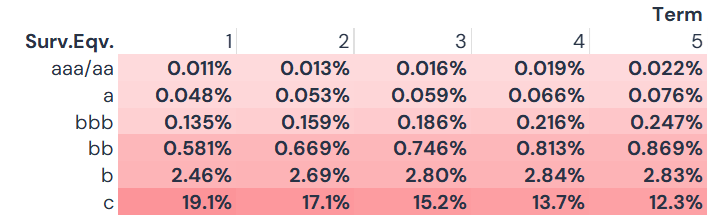
The c category 1-year default rate would have to be 12.3% (vs. 19.1%) to produce the same cumulative 5-year PD as the TM-based approach. The bbb category would have to be 24.7 Bps rather than 13.5 Bps – almost double. This category is a major upgrade/downgrade crossroads.
Plotting these 1-year equivalents on a log scale gives 1-year survival equivalent PD curves:

All credit category curves are upward sloping except for the c category, although the b category is almost flat.
With a suitable LGD assumption (e.g. 50%) these can be converted into Real World CDS spread equivalents. These can be compared with market spreads to derive “portable” market risk premiums.
For sectors where there are no traded CDS, consensus TMs for similar sectors can be used to create a set of real world spread equivalents, and the “portable” market risk premiums can be added back to give credible CVAs. Consensus data can be used to identify “similar sectors” and hence suitable market proxies for illiquid assets.
Get in touch to request your free Credit Consensus coverage check and overlap analysis, or for details of Credit Benchmark’s extensive consensus-based transition matrix dataset.