
CCP Monitor: Improving Risk Trends, Member Upgrades Dominate
Posted by Laura Saville on August 17, 2022

The latest Central Counterparty Clearing House (CCP) monitor produced by Credit Benchmark shows further improvements in credit quality in the two main regions. Figure 1 shows changes in credit risk over the last year (left hand chart), and current credit risk distribution (right hand chart), split by Europe, North America and Other.
European CCP credit risk was the first region group to improve, with a significant increase in credit quality from the beginning of this year. North American CCP credit risk has steadily improved from Feb-22 although at a slower rate than European CCPs. The broader “Other CCP” group shows its first improvement for over 6 months.
Overall credit quality is very high, with 60% of North American CCPs in the aa category and the majority of European CCPs in the a category. Outside of these regions, there are some CCPs in the bb (i.e. High Yield) category.
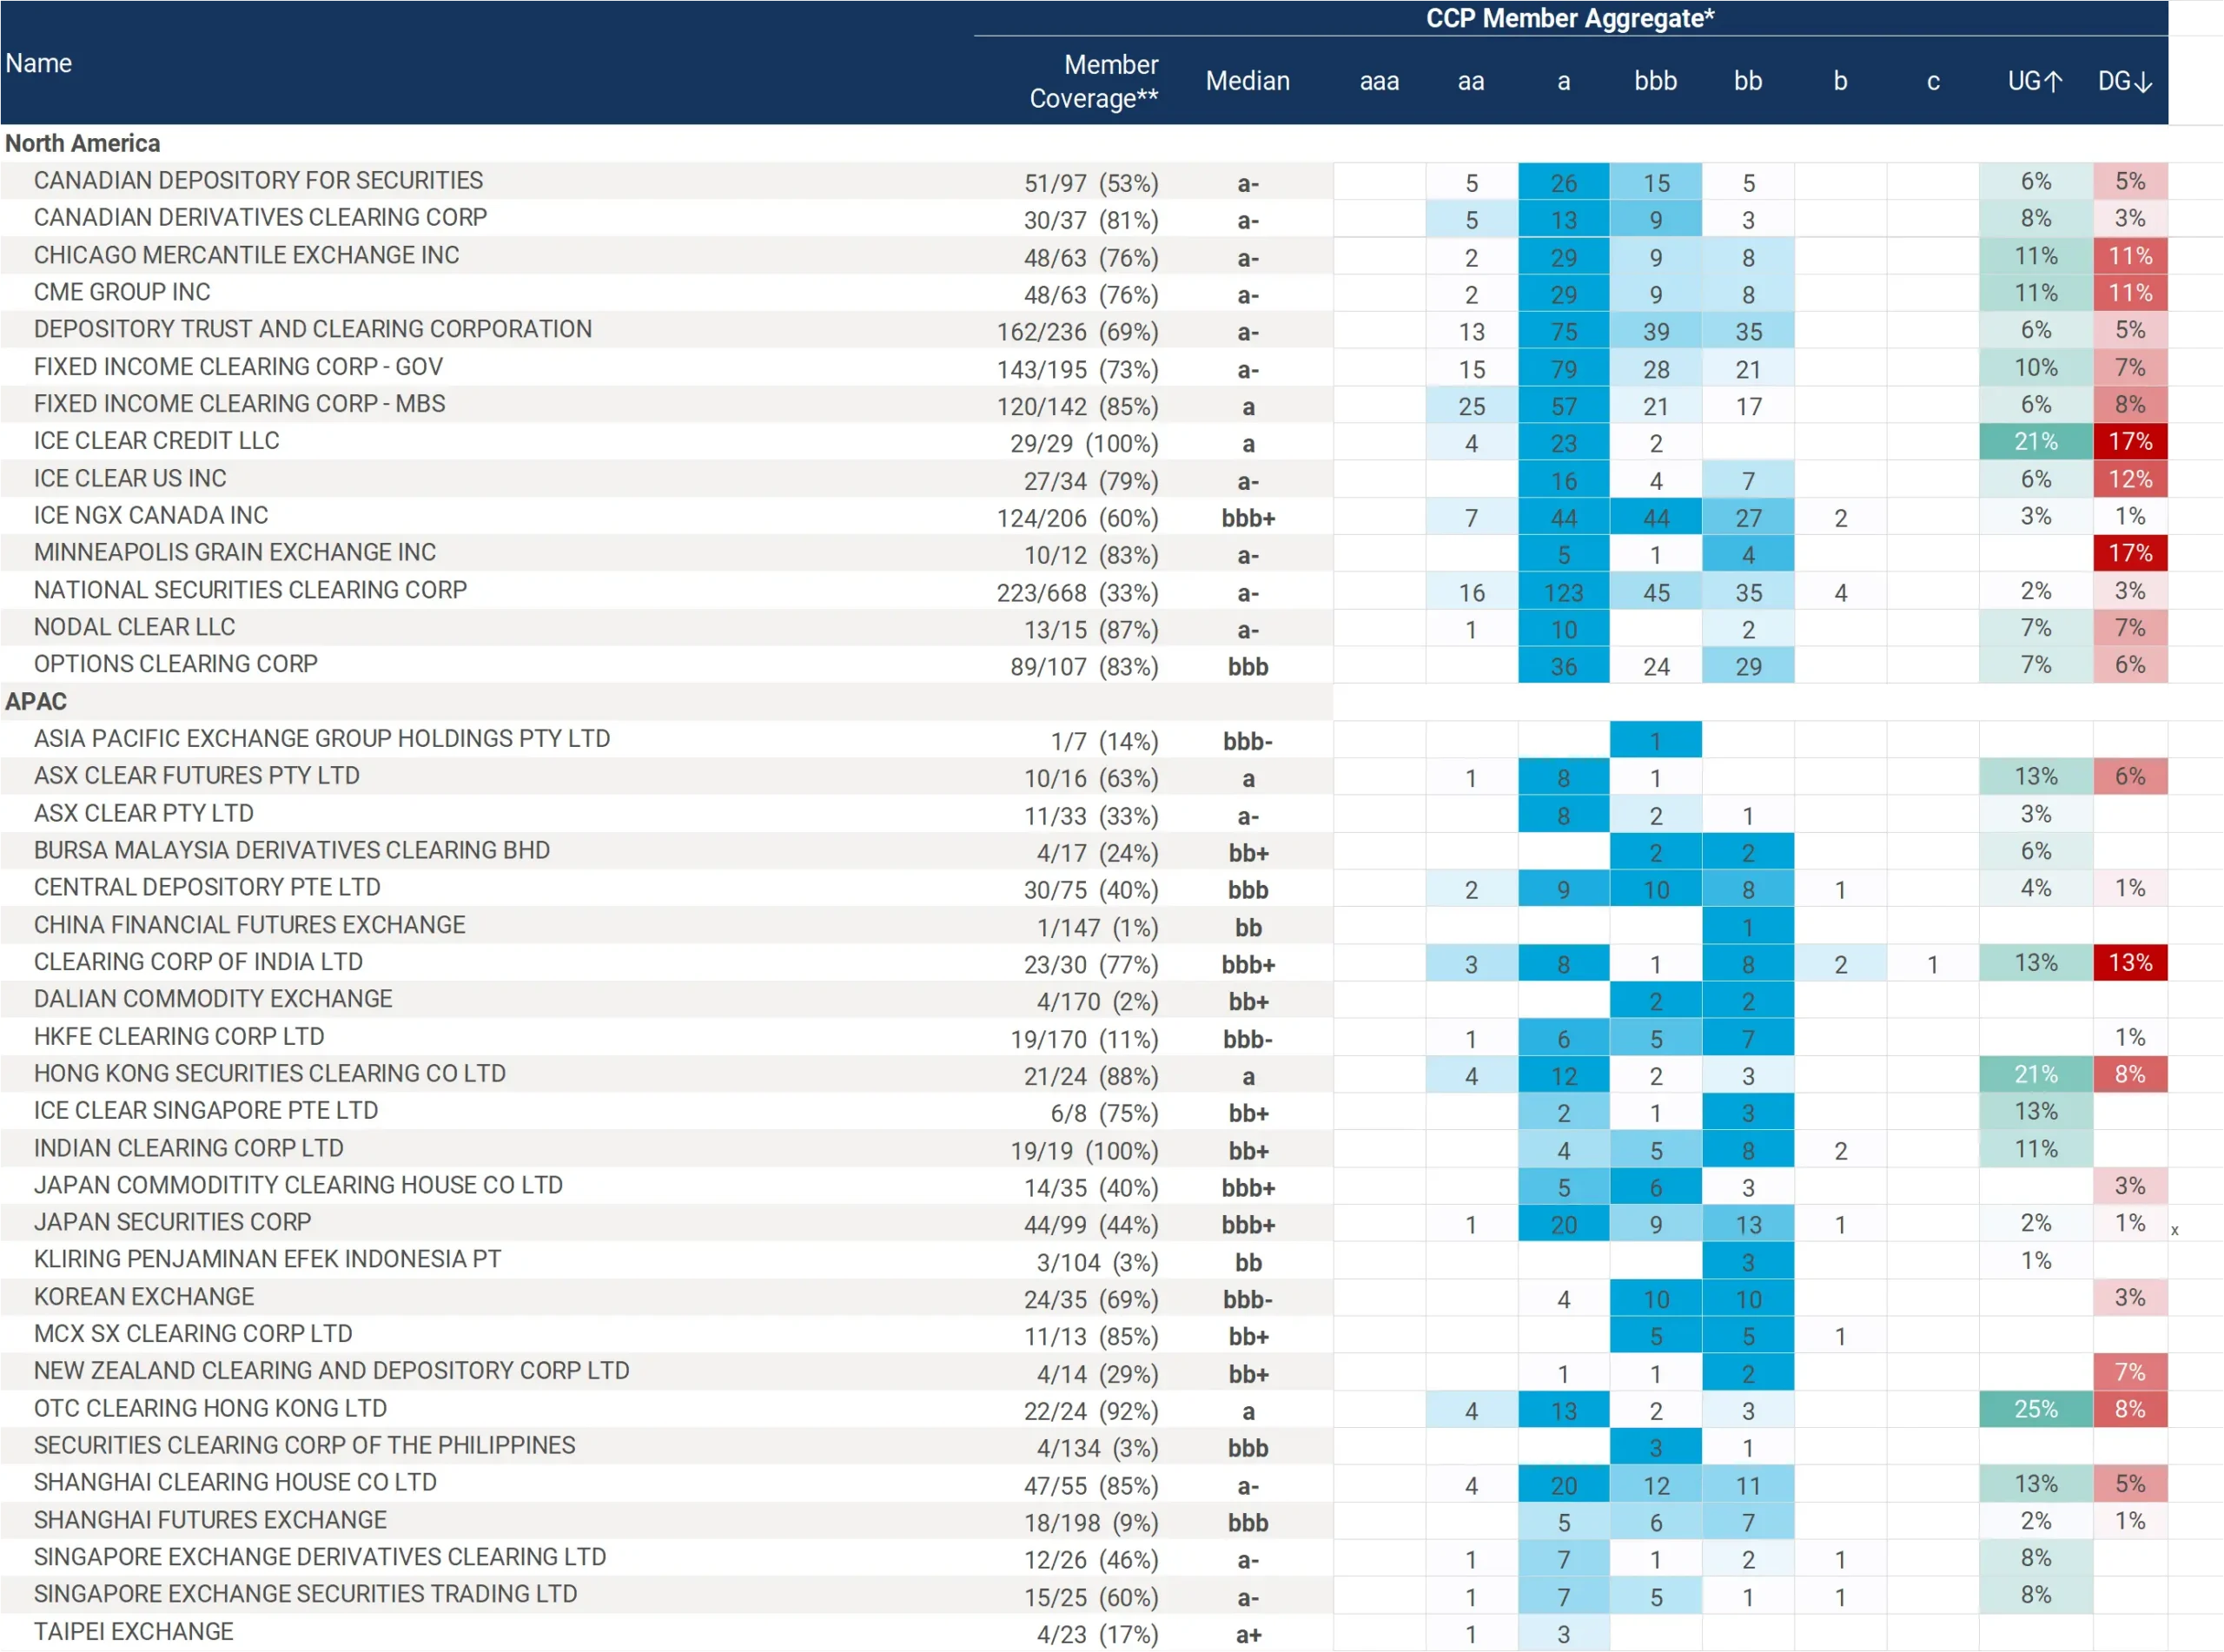
Figure 2 is an extract from the latest CCP monitor, showing median consensus credit risk data on CCPs members, as well as their credit distribution and the proportion of upgrades vs. downgrades. Note that CCP risk is not a linear function of member risk: median member risk does not necessarily reflect CCP direct credit worthiness.
Figure 2: Global CCP Aggregated Member Credit Risk
To illustrate this, Figure 3 shows Credit Consensus Rating (CCR) for some of the main CCPs – and many of these are not rated by the major CRAs.
Figure 3: Global CCP Entity Consensus Credit Risk
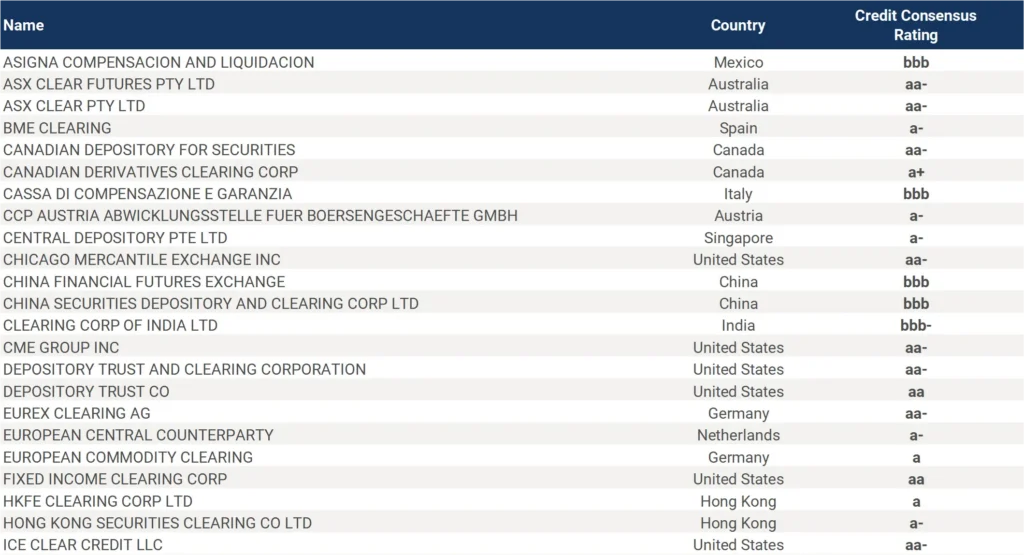
For example, the Canadian Derivatives Clearing Corporation has a CCR of a+, but the median rating across more than 80% of the members in Figure 2 is a-. Similarly, the CME has a CCR of aa- but the median across 76% of its members is again a-.
CCPs are major users of Credit Consensus data, and as interest rates rise there is a growing focus on credit risk concentration and early indications of changes in credit trends. Consensus data is also available as a download for more than 1000 aggregates, including various financial subsectors. These can be used to calculate upgrade/downgrade ratios and default risk correlations across geographies, industries and sectors.
Download PDF
Please complete your details to download the PDF of this report.
"*" indicates required fields
By submitting this form you agree to Credit Benchmark’s Privacy Policy and Terms and Conditions.




Want to see Credit Benchmark in action?
Schedule a short 30 minute demo and let our team walk you through the platform, demonstrate key capabilities, and answer any questions live.